The problem
What actually drives an app's revenue? The obvious answers, downloads, active users, updates, feel right, but a business can't price, forecast or invest on a hunch. It needs the size of each effect and a reason to believe the number. So the task had two halves: model revenue across four national markets, and work out how far the model could actually be trusted.
Approach
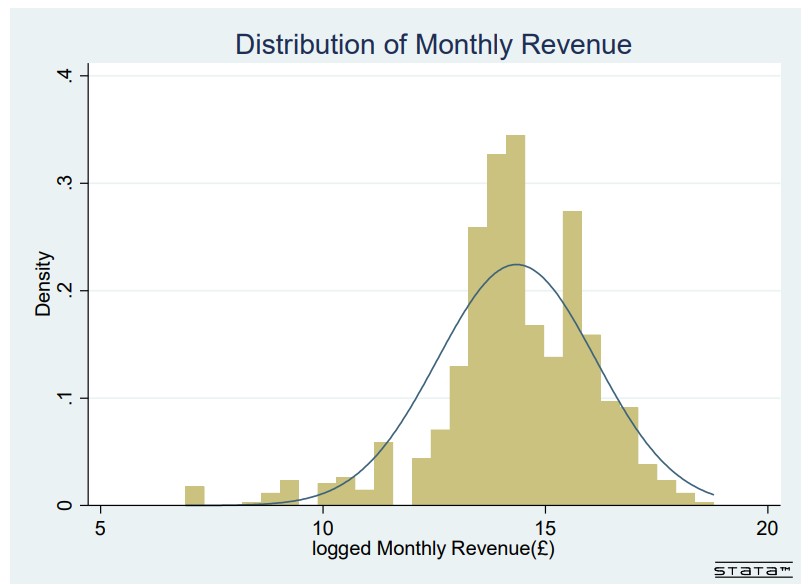
Fitted an OLS regression with log-transformed variables (log revenue on log downloads, log active users and update frequency), so the coefficients read as elasticities and the residuals behave. That's the straightforward part. The real work is the diagnostic and robustness pass that separates a defensible model from a naive regress: I tested for heteroskedasticity with both the White test and Breusch-Pagan / Cook-Weisberg, moved to robust standard errors where it mattered, and confronted the endogeneity head-on. Download counts are plausibly co-determined with revenue, so rather than pretend the OLS estimate was clean, I set out instrumental-variable strategies to address it. All in Stata.
Result
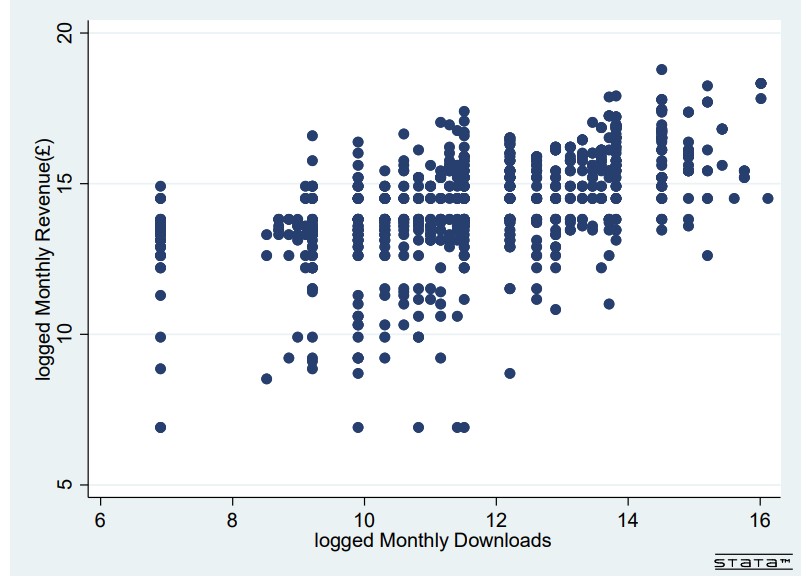
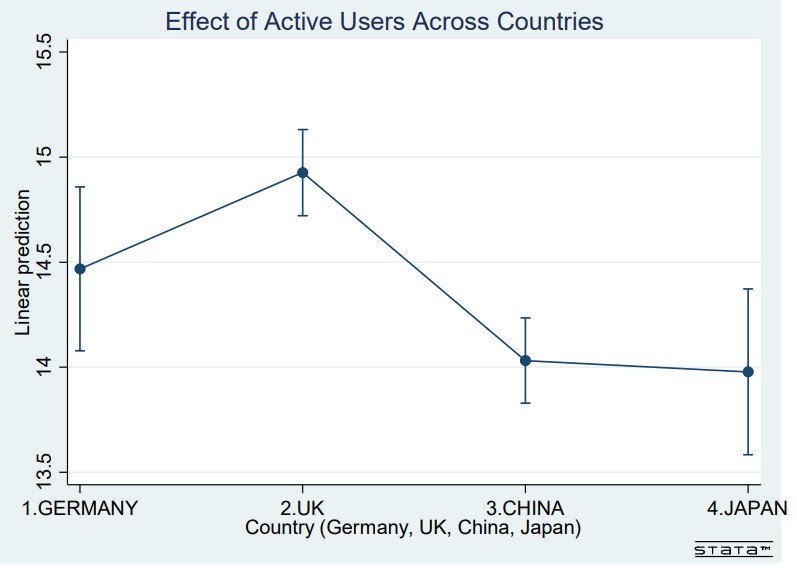
The model explains roughly 64% of the variation in app revenue (R² = 0.640), is significant overall, and shows revenue scaling clearly with downloads and active users, with genuine country-level differences across the four markets. But the R² isn't the headline. The headline is knowing what threatens it: flagging the heteroskedasticity and correcting for it, and naming the endogeneity instead of burying it, so anyone relying on these numbers knows exactly how far to push them. That is the discipline a risk or data analyst is paid for. A coefficient is only ever as trustworthy as the assumptions behind it.
But the headline of the write-up isn't the R², it's the honesty about what threatens it. Flagging the heteroskedasticity, correcting for it, and naming the endogeneity rather than burying it is exactly the discipline a risk or data analyst needs: a coefficient is only as trustworthy as the assumptions behind it.
Tools
Stata OLS Log-log model White test Breusch-Pagan