The problem
Benchmark the operational efficiency of 130 US electricity utilities: which are getting the most out of what they spend, and which are lagging. In a regulated industry this isn't academic, it's how a regulator sets price controls and how a utility justifies its costs.
Approach
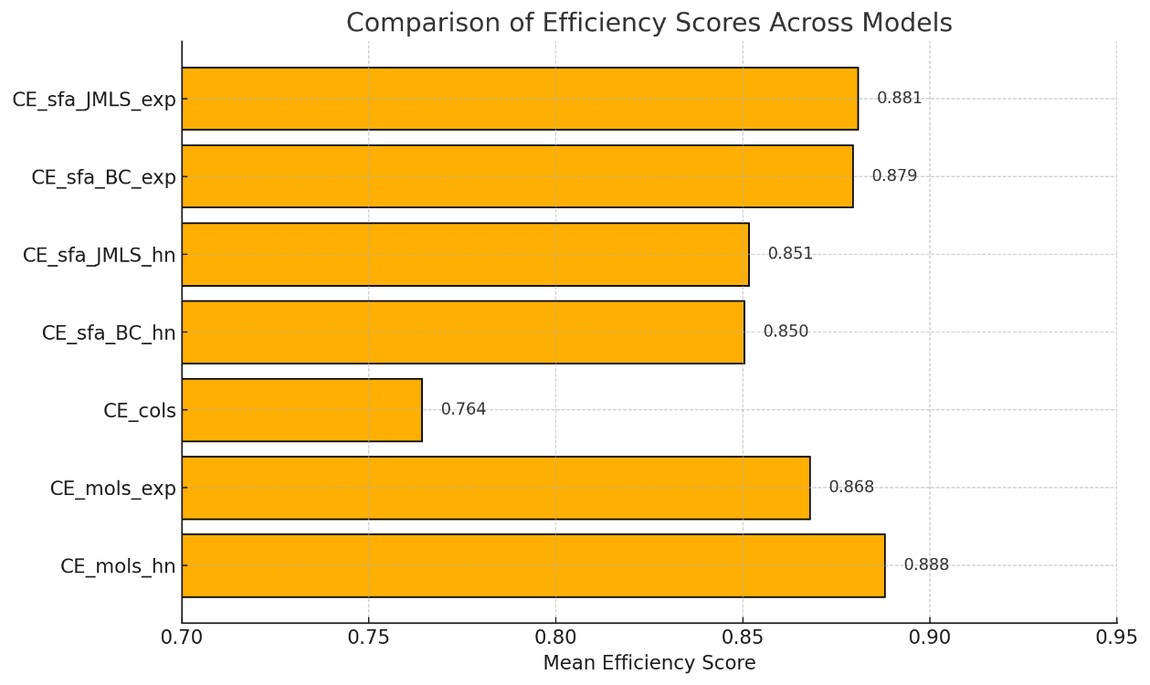
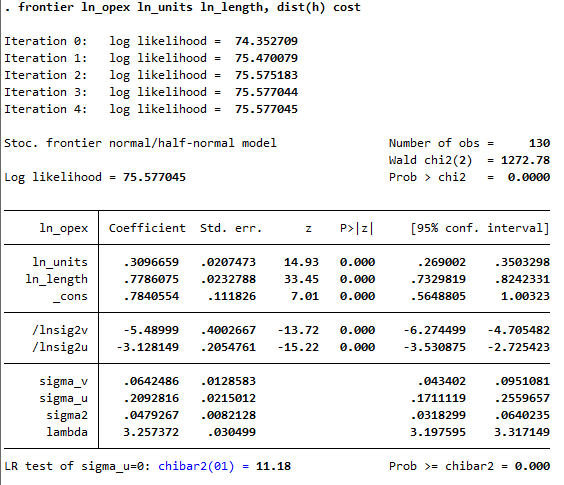
Ran two complementary frontier methods. First, Stochastic Frontier Analysis: a Cobb-Douglas cost function (log opex on log units and network length) estimated in Stata's frontier routine, which separates genuine inefficiency from statistical noise. Second, Data Envelopment Analysis, a non-parametric frontier for peer benchmarking. Returns-to-scale tests (CRS versus VRS) justified the model choice, and running both methods shows where the efficiency verdict is robust and where it depends on the approach you take.
Result
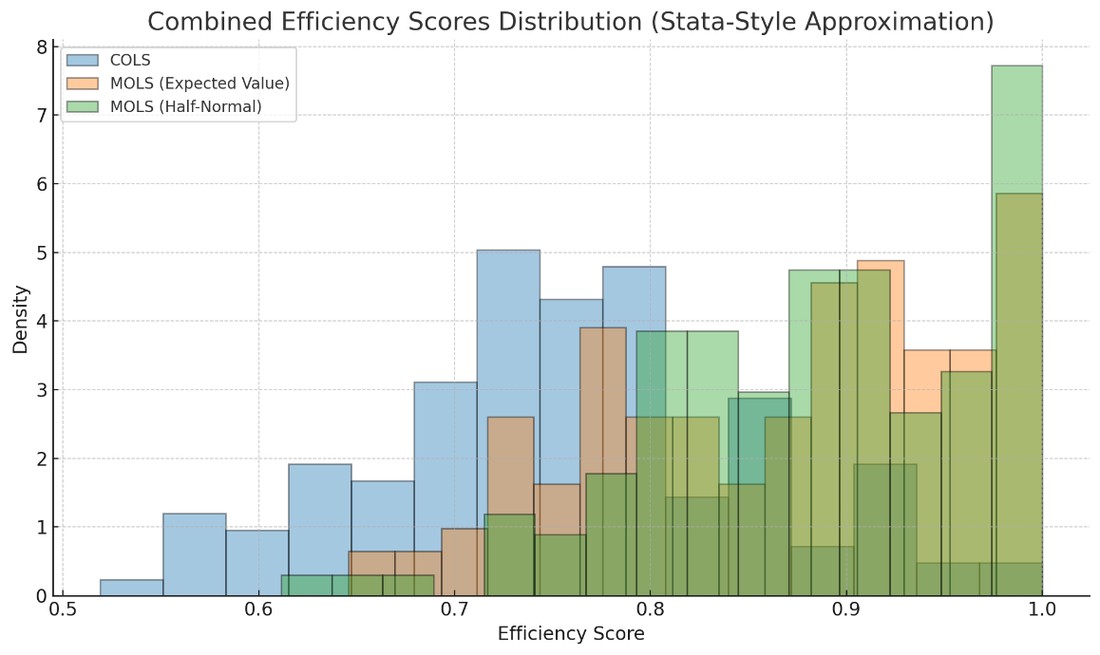
Efficiency scores for all 130 utilities, cross-checked across estimators: only 2 came out fully efficient and 15 fell below 50%, a wide spread of performance. The point of a spread like that is what you do with it, flag the laggards for scrutiny, set realistic improvement targets against the frontier, and treat the robust verdicts differently from the ones that shift between methods. It's the same benchmarking approach regulators and risk functions use across utilities, banking and healthcare.
Tools
Stata DEA SFA Cobb-Douglas