The problem
Small businesses are hard to lend to: their filed accounts are thin, late, and backward-looking. But their bank account tells the truth about cash coming in and going out, and Open Banking exposes exactly that, with the borrower's consent. This project scores businesses on cash-flow behaviour and then answers the committee's real question: if revenue fell 20% across the whole book, how many run out of cash within a year?
What it does
The pipeline runs generate → model → measure → stress test → visualise → deploy:
- Generate a realistic synthetic dataset as bank-account movements, a retailer shows one daily acquirer settlement net of fees; an invoice business shows lumpy receipts after a collection lag. Fully reproducible from a single seed.
- Model it in PostgreSQL with foreign keys, indexes, and CHECK constraints that enforce financial invariants, a credit can never be negative.
- Measure the metrics lenders use, DSCR, cash runway, cash-flow volatility, overdraft utilisation, with rolling windows.
- Stress test the portfolio against a macro revenue shock, using operating leverage so variable costs flex while fixed costs don't.
- Visualise it in an interactive Streamlit dashboard with a live stress slider.
Headline results
Share of the 500 firms that run out of cash within 12 months as a revenue shock deepens:
| Revenue shock | 0% | 10% | 20% | 30% | 40% | 50% |
|---|---|---|---|---|---|---|
| Fail within 12m | 26.6% | 29.4% | 34.0% | 38.2% | 42.0% | 47.2% |
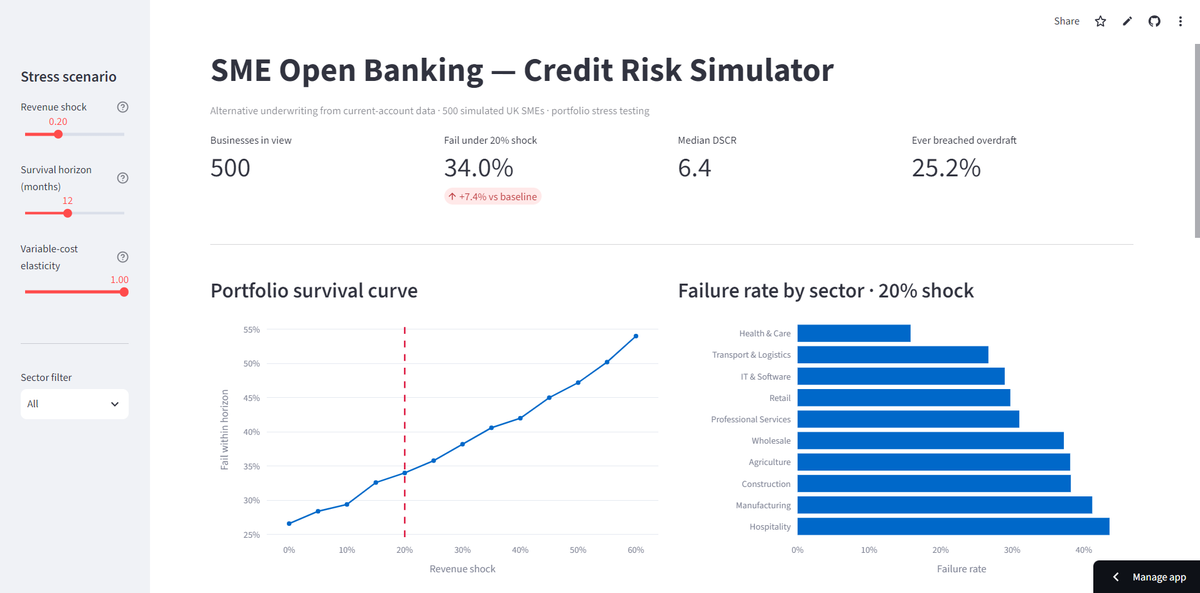
The clearest result is risk separation. At a 20% shock, healthy firms fail at 28% against a deteriorating cohort at 85%, the model tells the two apart cleanly. That separation is the whole point, because it gives a lender a defensible basis for the three decisions a credit committee actually makes: who to support, who to price for the extra risk, and who to step back from, driven by live cash-flow behaviour rather than stale filed accounts. The most fragile sectors are Hospitality (44%) and Manufacturing (41%), the thin-margin, high-fixed-cost sectors, exactly as operating leverage predicts.
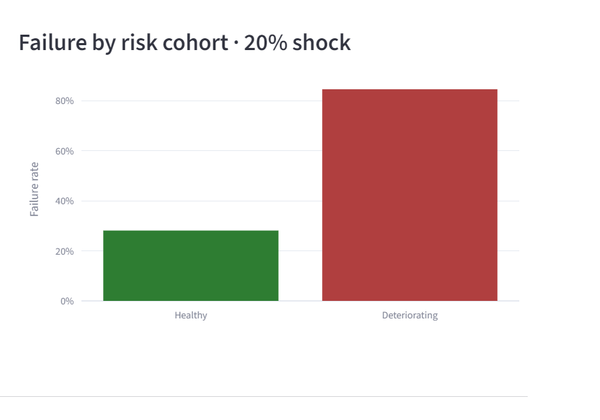
Crucially, the results are cross-validated: the SQL views and the Python engine compute the same metrics independently and agree, median DSCR 6.4, overdraft breach 18% for healthy firms versus 83% for the deteriorating cohort.
Design decisions
- Movements, not sales. The whole model reflects what a lender using Open Banking actually sees: dated money movements on an account.
- Internally-consistent cost stack. Each sector's materials, labour and overhead sum to leave a realistic net margin, so firms don't spend more than they earn.
- VAT modelled properly, inclusive receipts and bills, netted off with a quarterly remittance, rather than as a phantom cash drain.
- Label kept separate from behaviour. The injected deterioration flag (what you'd predict) is distinct from the overdraft-breach evidence (what you'd predict it from), avoiding target leakage.
- Integrity in the schema, not just the app code.
Tech stack
Python (pandas, NumPy) · PostgreSQL / Supabase · Streamlit · Plotly · Git. The SQL layer builds the schema, loads the generated data, and defines the metric views; the Python engine computes rolling metrics and runs the stress engine; Streamlit serves the interactive dashboard.