Business Analyst · Surrey, UK

I run the operation, and I analyse it, so I know which problems are worth solving.

I work in the gap between the people who have the problem and the people who build the fix. Usually I'm on both sides of it: the one asking for the analysis, and the one who then has to act on it. Five years across financial services and operations taught me to pin down what's actually being asked first, then deliver an answer someone can actually decide on, whether that's a KYC process, a credit decision, or a sanctions screen.

Worked across
  • Financial services
  • Mortgage & credit risk
  • KYC & onboarding
  • Financial crime & sanctions
  • Retail operations

Business analysis from problem to decision: requirements, process, data, recommendation.

£0
Store turnover managed
since opening Jan 2026
0%
Waste reduced
~180 → ~45 items/day
0
Sanctions records screened
OFAC · UN · UK sanctions
0
Tools delivered
plus a tested warehouse
Experience

Five years turning business problems into decisions

I started in financial services (mortgage risk, KYC, onboarding) and moved into operations, where I now run the business I analyse. The thread running through all of it is the same: work out what's really being asked, then see the answer through to a decision.

  1. Jan 2026 — Present Current · flagship

    Operations & Data Manager · Grape Tree, Godalming

    • Accountable for a live retail operation from day one: £405k+ turnover since I opened the store in January 2026, above target every month and 160% of plan in the opening month.
    • Agreed the analytical remit with my regional manager (sales, stock, profit, forecasting and team performance) and secured access to the store's data. I identified the reporting and forecasting gaps myself, took the team's input on what was slow or manual, and turned both into the requirements for Storely.
    • Scoped and built Storely, the store's own analytics and operations platform, then tested it with the team through repeated feedback rounds until it matched how they actually worked. The team now uses it every shift, and the stock, forecasting and team-performance analysis I used to wait on is self-served in minutes.
  2. Aug 2025 — Aug 2026

    Team Leader · Co-operative Group, Farncombe

    • Led a team of 12 in a store turning over roughly £100k a week, peaking past £120k.
    • Investigated persistent bakery waste, analysed the stock and waste data in Logile, and recommended a demand-led bake plan. Daily waste fell from around 180 items to 45, a cut of roughly 75%.
    • Rebuilt labour scheduling around demand patterns and local events rather than flat hours-earned rules, so cover matched when the store was actually busy.
  3. Mar 2025 — Aug 2025

    Business Analyst · XPark Games — university-arranged placement

    • Part of a four-analyst team. Designed the survey instrument that captured what users actually wanted, and gathered 1,500 respondent profiles as the evidence base for the product decision.
    • Ran the ETL in R and Power Query, then descriptive, correlation and segmentation analysis on the responses. The headline finding, that more than half wanted AI-integrated features, shaped the product direction, and the work landed within the £3,000 budget.
  4. Apr 2022 — Jun 2023

    Business Administrator · Mannivesh Financial Services

    • Segmented the client base by value, risk and investment frequency so the firm could focus effort on its high-value, higher-risk investors.
    • Managed 180 KYC records to regulatory standard and reviewed around 50 applications a week, acting as the quality gate before cases reached compliance.
  5. Jun 2021 — Mar 2022

    Business Process Analyst · Tata Consultancy Services — CIBC mortgages

    • Applied the client's risk-classification criteria to mortgage and loan documents at 150 checks an hour, holding 98% accuracy against a 90% SLA, one of a five-person team on the CIBC account.
    • Built the end-of-day stakeholder report in Power BI and Excel: a risk-tier breakdown with actions, escalations, and a duplicate- and fraud-suspect section, giving the client a daily view of risk exposure to act on.
Case studies

From business problem to working solution

Each one is live or on GitHub, and each follows the same line: the business problem, how I worked it, and the decision or outcome it delivered.

Retail · operations

Storely

Live · used daily

Problem Store operations were scattered across paper and spreadsheets, and any real performance or stock insight meant waiting on head-office and stock-team reports, too slow to act on day to day.

Approach Agreed the remit and data access with my regional manager, then gathered requirements from my own analysis and from what the team flagged as slow or manual. Built and iterated Storely with them through repeated rounds of user testing. Under the hood: React and Supabase, CSV ETL from Retail Advantage, Holt's demand forecasting, ABC stock classification, and per-person row-level security.

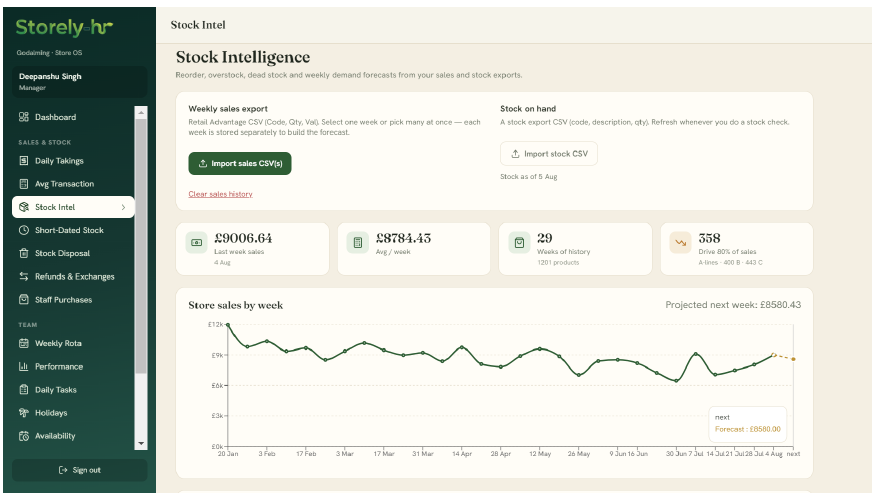
Impact £405k+ turnover since opening; 1,201 products under weekly forecast; and waste, refunds, banking and rota on one auditable trail a team of 5 uses every shift, insight the store no longer waits on head office for.
ReactViteSupabasePostgres + RLSHolt’sVercel
Live demo
Storely Stock Intelligence: 1,201 products, 29 weeks history, Holt’s weekly demand forecast
Live demo
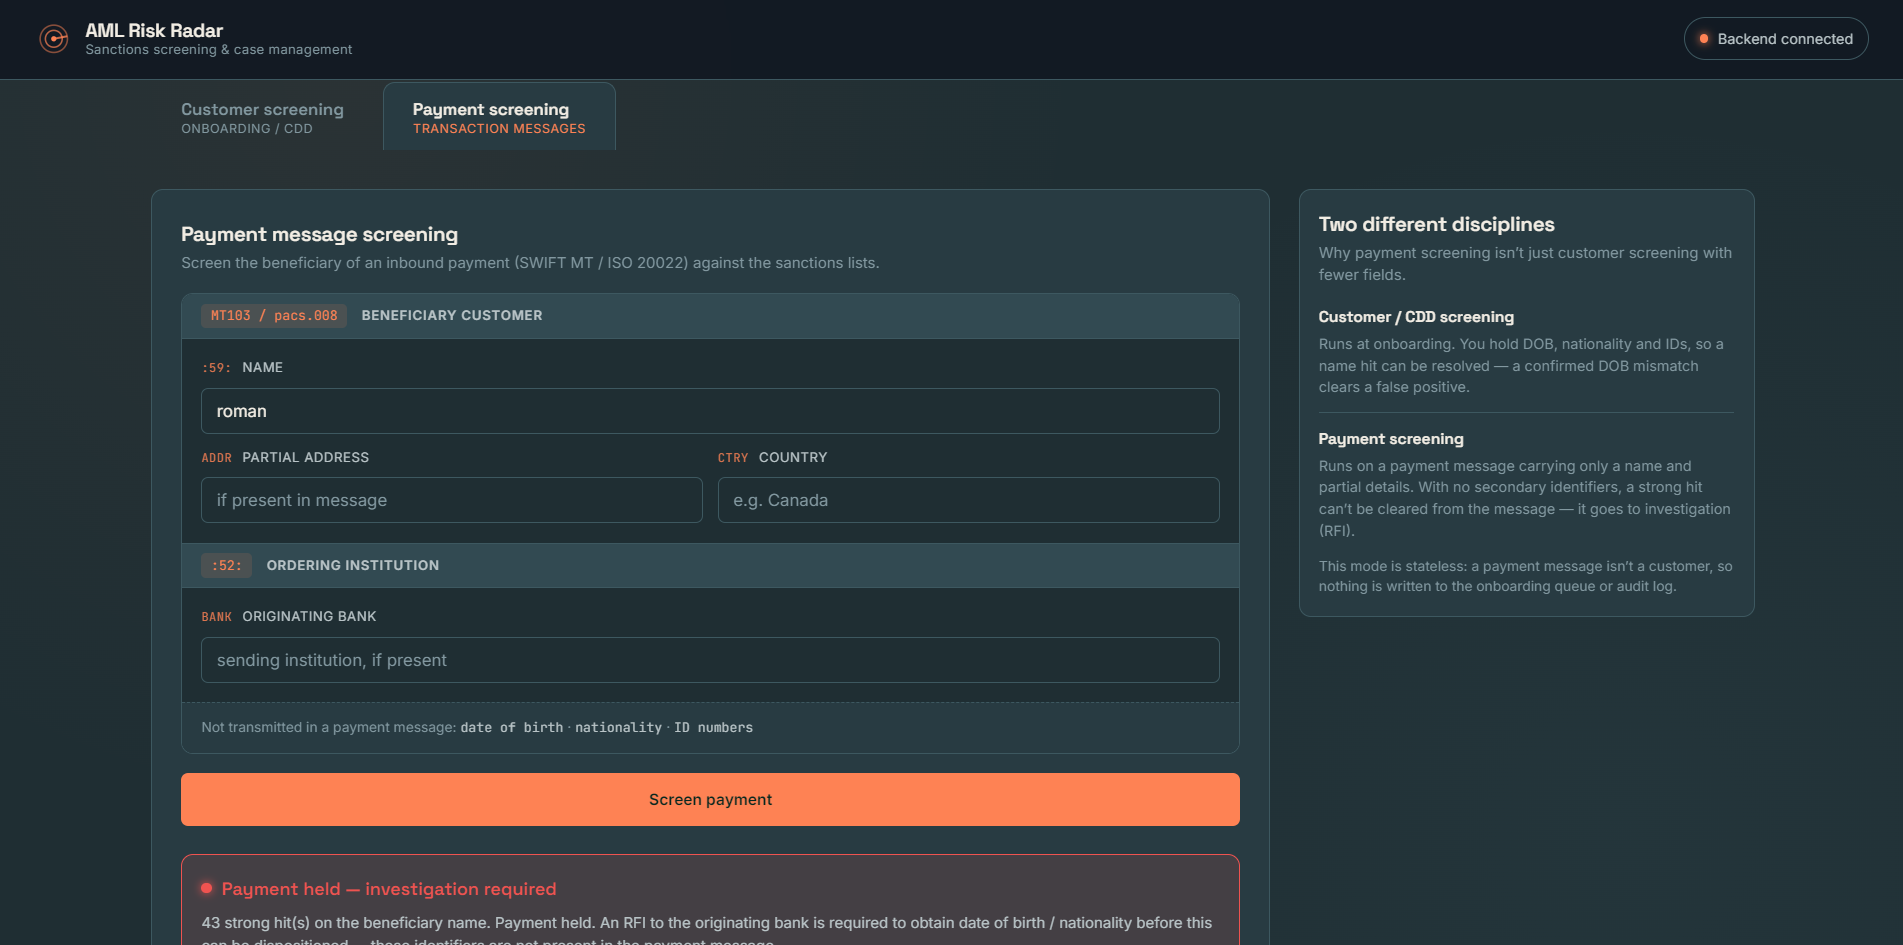
AML Risk Radar payment screening: an inbound SWIFT MT / ISO 20022 message screened against the sanctions lists, with a strong-hit result held for investigation
Financial crime · RegTech

AML Risk Radar

Live

Problem In first-line customer due diligence, analysts lose most of their time clearing false positives: one common name matches dozens of sanctions entries that were never the same person.

Approach I mapped how a CDD analyst makes the screening decision, then built the tool around it: names checked against 26,387 real sanctioned entities from OFAC, UN and UK, with fuzzy matching and identity checks to clear the obvious non-matches. One rule stayed non-negotiable: missing data never suppresses a match, because a missed hit costs far more than a false alarm.

Impact An empirical 55–83 threshold that caught every observed true positive while clearing the false positives, with cross-watchlist grouping that collapses one subject's hits into a single audited decision.

FastAPIReactPostgreSQLSupabaseRapidFuzzRender + Vercel

Scope: a portfolio project on real public sanctions data; PEP and adverse-media are clearly-labelled synthetic because the real feeds are licensed.

Financial crime · data engineering

FinCrime transaction monitoring

Warehouse

Problem A transaction-monitoring team has to answer two questions at once: which payments are worth a human’s attention, and whether every number they report can be trusted. I set out to reproduce that workflow end to end, from raw payments to tested, reportable datasets.

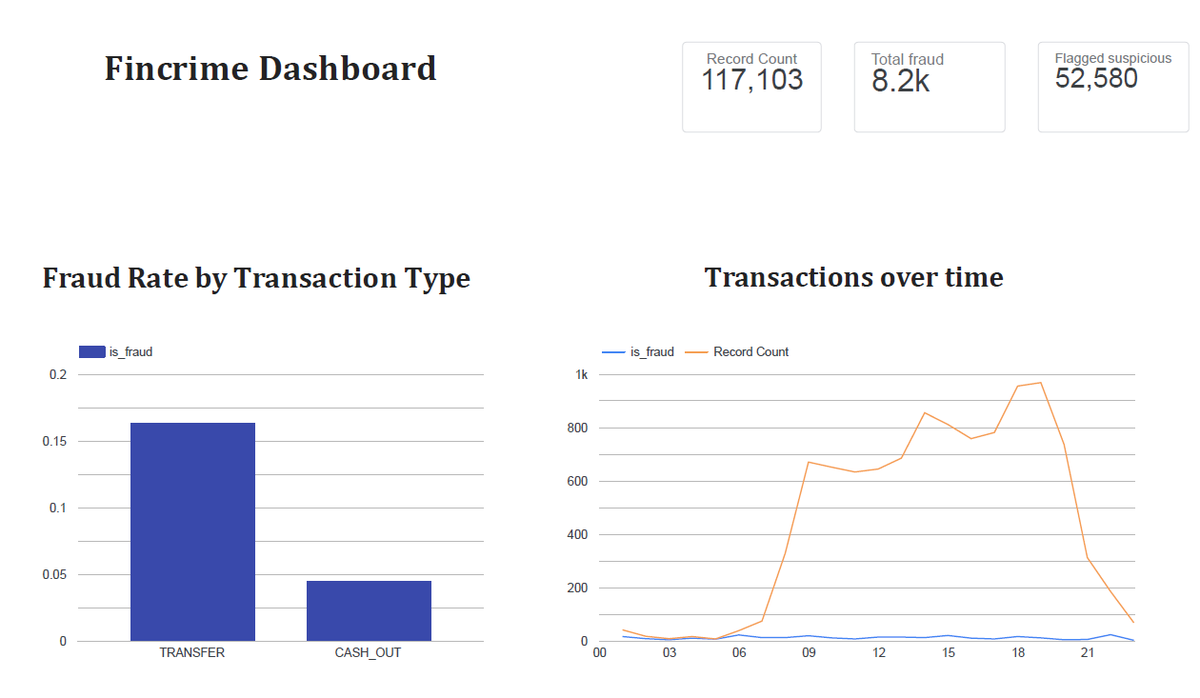
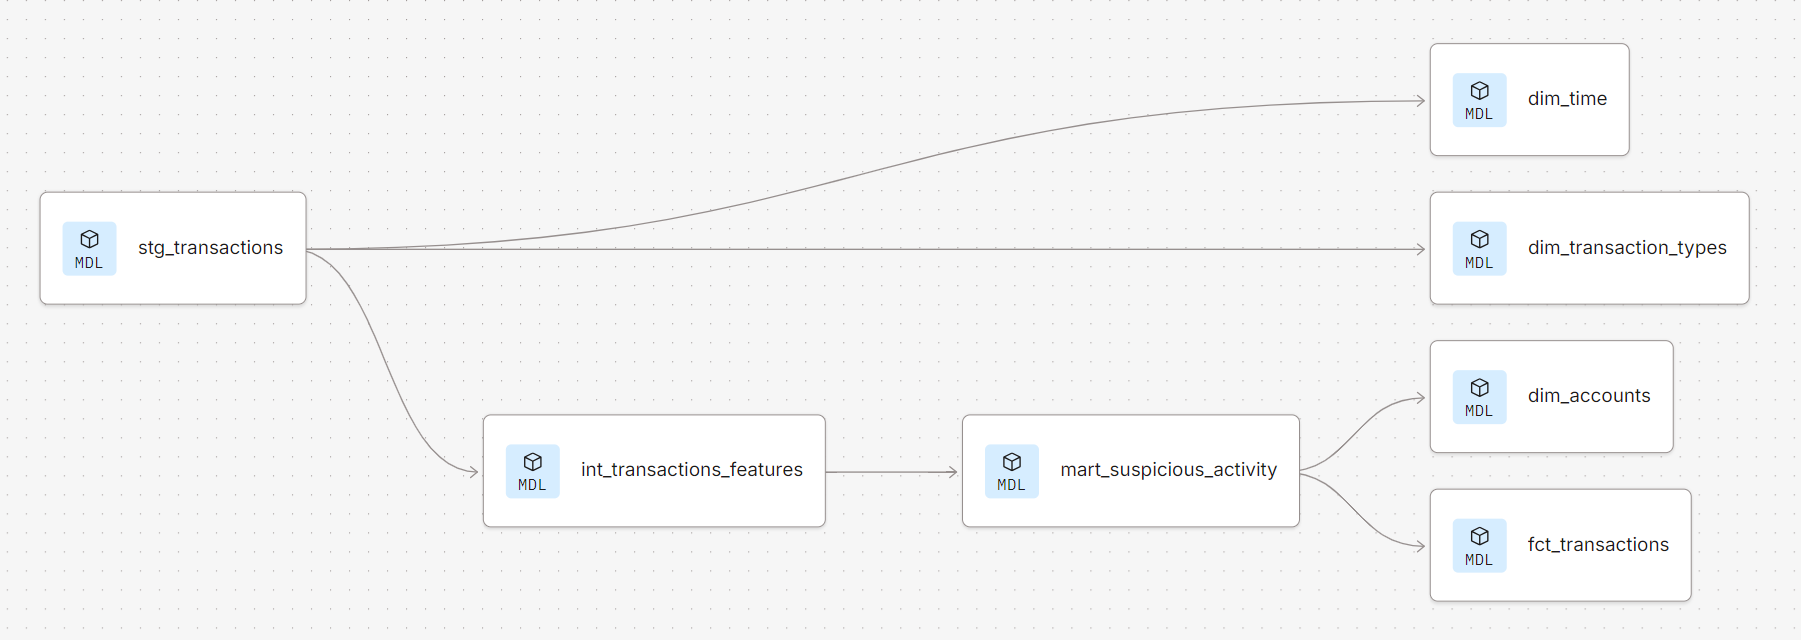
Approach Raw data in BigQuery, transformed and tested with dbt into a star schema, scored for fraud risk, evaluated against real labels, surfaced in Looker Studio. Three dbt test types enforce integrity so any figure traces back to source.

Impact 117,103 transactions modelled, with the alert threshold treated as a business decision rather than a fixed default: around 83% recall when the aim is to catch as much as possible at first-line review, against 99.4% precision when it is tuned to auto-action a case. Two different risk appetites, two different settings.

Scope Synthetic PaySim data; fraud prevalence is inflated by design and scoring is rule-based, chosen for interpretability over real-world detection rates.

BigQuerydbtLooker StudioSQLGCP
Looker Studio dashboard: 117,103 transactions, 8.2k fraud, fraud rate by transaction type dbt lineage: staging transactions through an intermediate features model to the suspicious-activity mart, then out to fact and dimension tables Built with dbt, Google BigQuery and Looker
Live demo
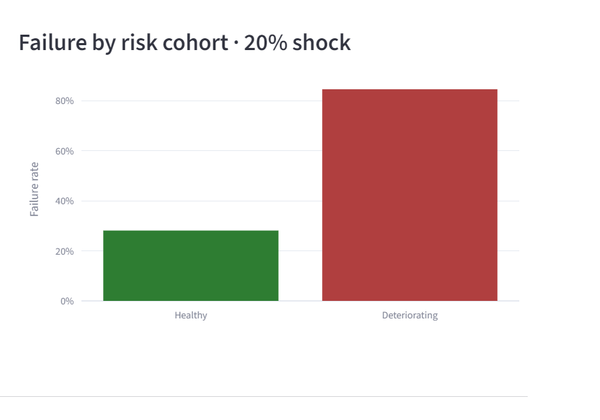
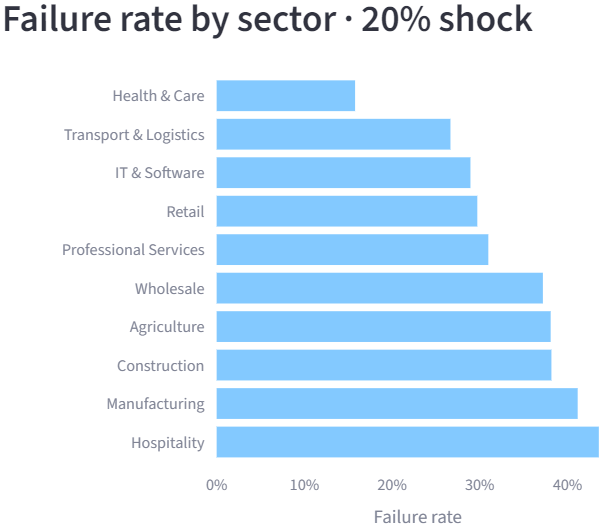
Failure by risk cohort at 20% shock: healthy 28% versus deteriorating 85% Failure rate by sector at 20% shock: highest in Hospitality and Manufacturing, lowest in Health and Care
Credit · decision analytics

SME Credit Risk Simulator

Live

Problem Small businesses are hard to lend to: filed accounts are thin and backward-looking, so a credit decision made on them is half-blind. The bank account tells a truer, more current story, and Open Banking makes it available to read.

Approach Score each firm on the cash-flow signals a credit analyst already trusts, debt-service cover, runway, income volatility and overdraft reliance, then stress the whole book against a revenue shock using operating leverage to see who breaks first. Everything is modelled as bank-account movements rather than till sales, so it reflects how a lender would actually see the business.

Impact Across 500 firms · ~435k transactions: at a 20% shock, healthy firms fail at 28% versus a deteriorating cohort at 85%, a clean risk separation, cross-validated between the SQL and Python engines.

Scope Synthetic, reproducible from seed 42. Not real businesses.

PythonPostgreSQLStreamlitPlotly
Product · SQL education

Sprout SQL

Live · free

Problem Most "learn SQL" tools have one of two flaws: they grade by matching your text, so a correct query written a different way gets marked wrong, or they never let you run a real query at all. Neither actually teaches the skill an analyst needs.

Approach I specified the whole product up front in a six-document set, product requirements, software requirements and architecture, then built to it: a genuine SQLite engine running in the browser via WebAssembly, with answers graded by comparing result sets rather than text. Every reference query is engine-verified before it ships.

Impact 7 worlds · 118 lessons · 181 hand-checked exercises, free, no signup to try. A finished product that proves both the SQL depth an analyst role needs and the discipline to specify something properly before a line of it is built.

ReactTypeScriptsql.js / WASMSupabaseVercel
Live demo
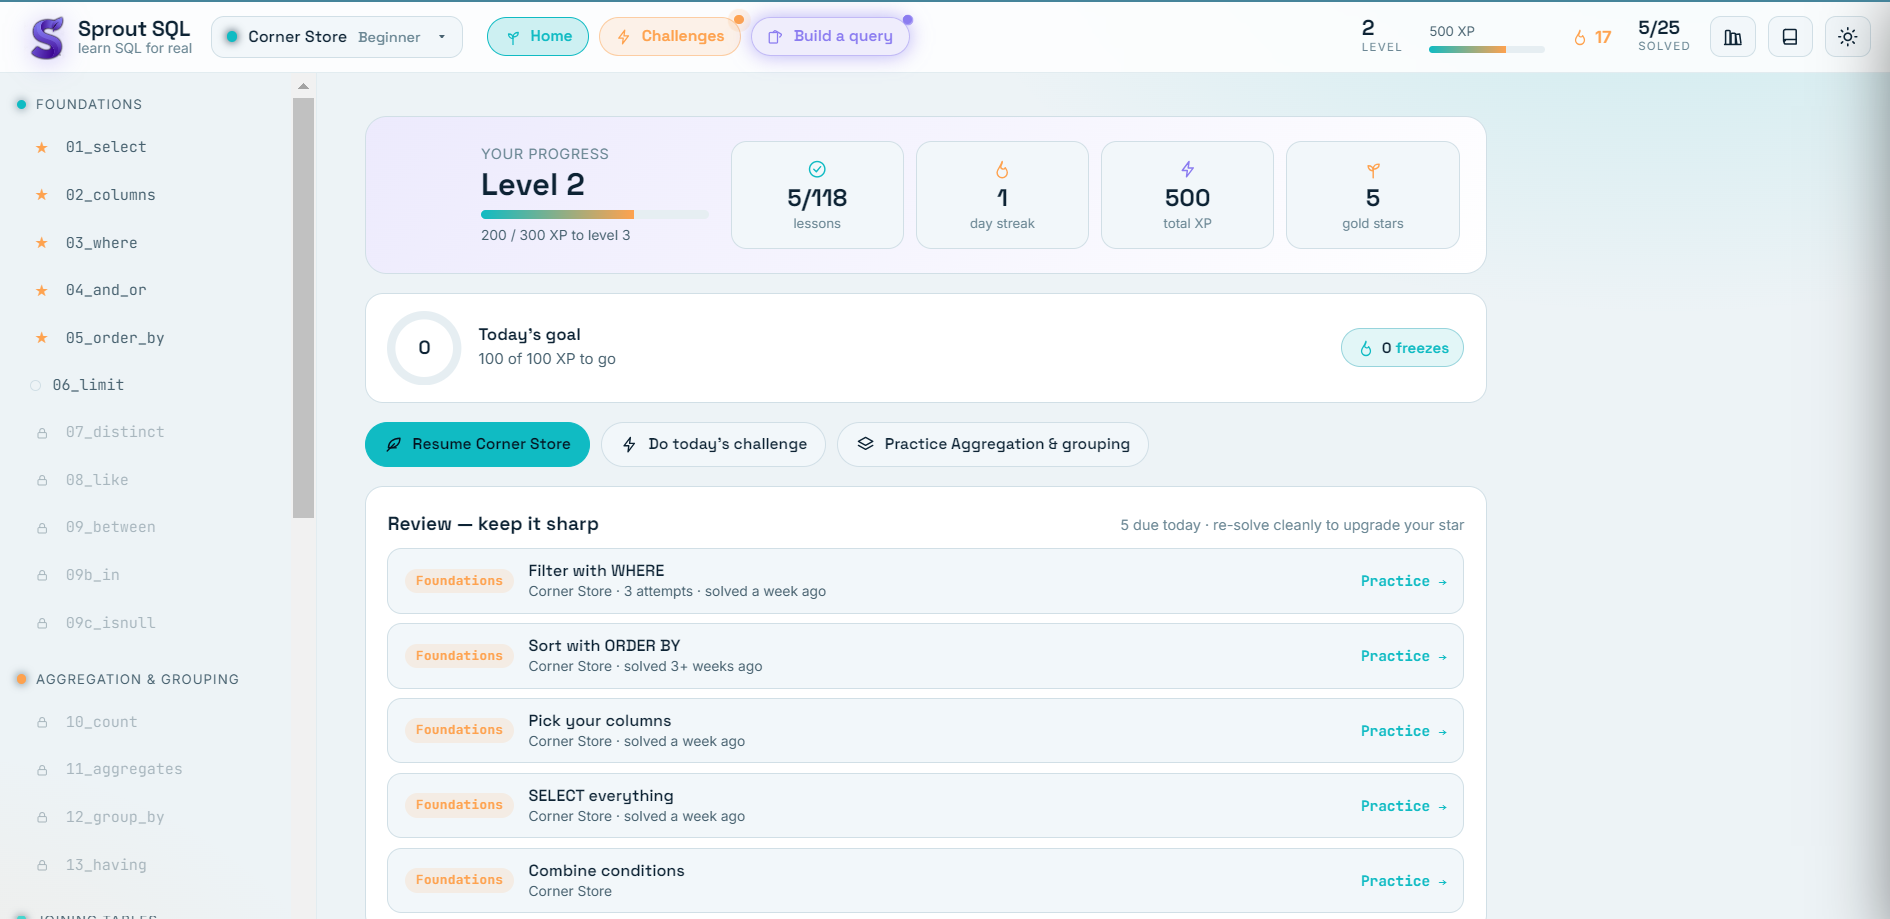
Sprout SQL dashboard: Level 2 progress, 5 of 118 lessons, a daily goal, and a spaced-repetition review list

Across these, a three-part financial-crime thread runs through the work: sanctions screening, transaction monitoring and credit risk, built on the stack a modern data team actually uses.

Core competencies

What I bring to an analyst team

Across requirements, data, domains and delivery: the capabilities I'd bring to an analyst role.

Requirements & process

Eliciting what stakeholders and users actually need, agreeing scope and sign-off, writing it up as a proper specification, then testing back against it with real users.

ElicitationProcess mappingPRD / SRSUAT

Data & analysis

Turning data into something a decision can rest on: SQL and BI, segmentation, forecasting, and evaluation I’d stand behind.

SQLPower BIExcelPythonRTableau

Domains

Not theory. Where the work has actually happened, from financial services through to running a retail operation myself.

Financial servicesAML / FinCrimeCredit riskRetail ops

Delivery & build

When it helps, I can build the thing myself: spec it, ship it, and then run it. The operator-analyst edge, end to end.

React / TSSupabasedbtBigQueryFastAPI
Education & certification

Credentials

MSc Business Analytics — Merit

University of Surrey · 2024–2025
  • Accredited by the IIBA, and Surrey is the first UK university to earn this, so the programme prequalifies for the professional-development requirement of the IIBA Core Certifications, CCBA and CBAP.
  • AACSB-accredited, with the Data Mining and Text Analytics module SAS-endorsed.
  • International Excellence Award.
  • Dissertation: GodotSim, a real-time discrete-event simulation tool built to make process modelling visual for non-technical users.
View degree
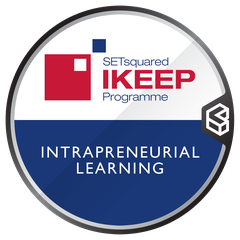
SETsquared IKEEP Programme — Intrapreneurial Learning badge

SETsquared IKEEP — Intrapreneurial Training Award

SETsquared Surrey · Mar 2025

A six-chapter intrapreneurship programme with a live workshop, covering innovation management, business modelling and strategy, communication and leadership.

Validate badge

BBA — Distinction

Career College, Bhopal · 2018–2021
  • Foundations in business statistics, marketing research, project management and management information systems.
  • Captained the university football team to a national championship.

BI Essentials for Finance Analysts — Power BI Edition

Corporate Finance Institute · via Coursera · Jul 2025

A four-course specialization: Power BI Fundamentals, Intermediate DAX & Time Intelligence, SQL Fundamentals for Data Analysts, and Financial Statements in Power BI, the last built on a real star-schema model.

Verify credential
Analytics projects

The analytical range behind the degree

Seven MSc projects, each worked on real data or a real process: risk modelling, forecasting, simulation, econometrics and efficiency analysis. They're coursework, not client work, but every one was taken from a business question through to a defensible answer. Open any card for the full method and the proof.

Simulation · dissertation

GodotSim

Built an open-source, real-time discrete-event simulation engine, SimSharp inside the Godot game engine, to make process simulation visual.

~11,667-word dissertation · C# / GDScript
SimSharpGodotDSR
View details
Risk modelling

Road-collision severity model

A Bayesian Network champion model predicting collision severity on real Surrey road-safety records, accuracy with interpretability.

78.4% accuracy · 2,480 real records
SAS ViyaBayesian
View details
Predictive modelling

Insurance propensity pipeline

A full KDD (Knowledge Discovery) pipeline predicting caravan-insurance purchase, balanced data, six models, four customer personas.

KDD · 6 models · 4 personas
SPSSRTableau
View details
Process simulation

Forensics workflow simulation

A Simul8 discrete-event model of a West Yorkshire Police DNA-forensics workflow, six models, 500 trials each, and a Monte-Carlo ROI in arrests per £m.

6 models · 500 trials · Monte-Carlo ROI
Simul8DES
View details
Segmentation & forecasting

Customer segmentation & forecasting

RFM segmentation with K-Means, plus ARIMA and Prophet forecasting on an online-retail dataset, who the customers are, and what demand does next.

RFM + K-Means · ARIMA · Prophet
Pythonscikit-learn
View details
Efficiency analysis

Utility efficiency analysis

DEA and Stochastic Frontier Analysis benchmarking 130 US electricity utilities, the regulated-industry efficiency method, cross-checked two ways.

DEA + SFA · 130 utilities
StataSFA
View details
Econometrics

App-store revenue model

An OLS log-log regression of app revenue across four markets, with the full diagnostic workup: heteroskedasticity tests, robust errors and an endogeneity discussion.

R² 0.64 · 800 apps · Stata
StataOLS
View details
1 / 7
Certifications

Verified credentials

The four courses behind the BI specialisation, each independently verifiable on Coursera.

Corporate Finance Institute · via Coursera

Power BI Fundamentals

Completed 8 Jul 2025
Verify
Corporate Finance Institute · via Coursera

Intermediate DAX & Time Intelligence

Completed 11 Jul 2025
Verify
Corporate Finance Institute · via Coursera

SQL Fundamentals for Data Analysts

Completed 13 Jul 2025
Verify
Corporate Finance Institute · via Coursera

Financial Statements in Power BI

Completed 19 Jul 2025
Verify
Power BI · credential work

Power BI, put to work

Two dashboards from the Coursera BI specialisation, on public datasets rather than client work, but proof I can model, measure and lay out a report in Power BI rather than just name it on a skills list.

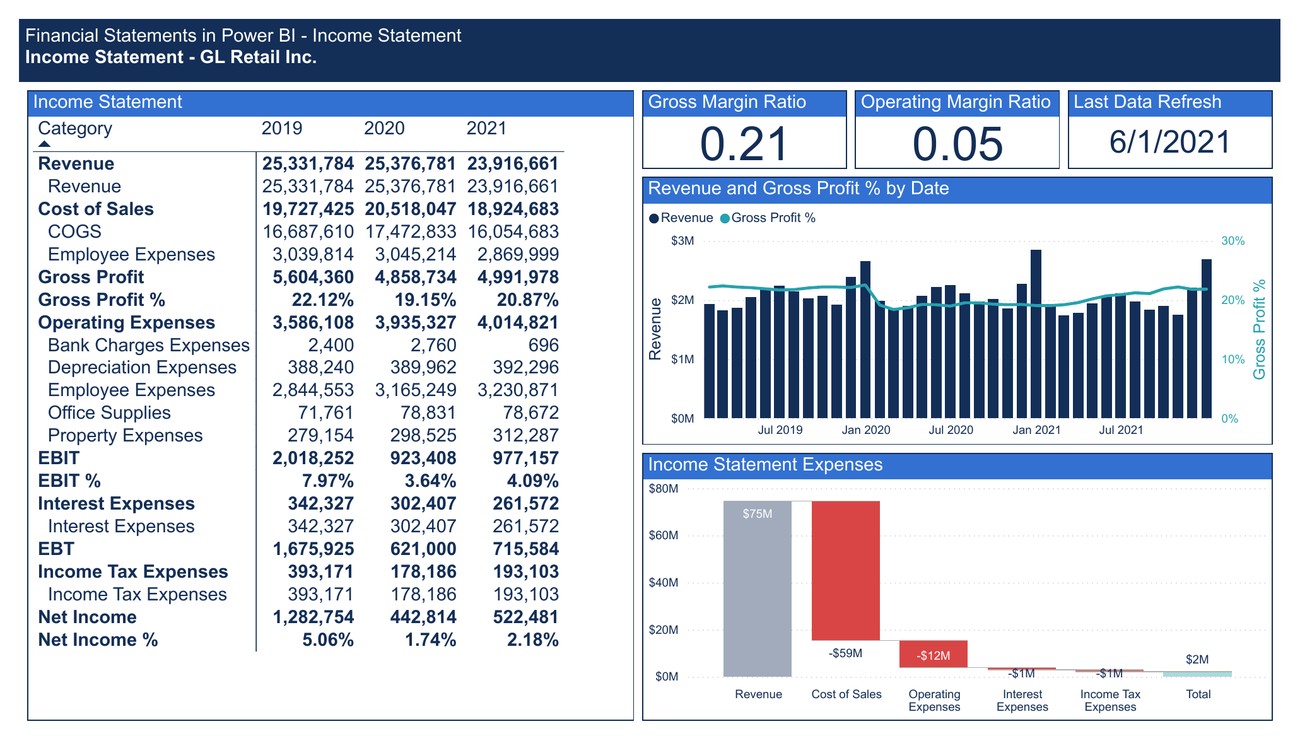
Financial Statements Power BI report — Income Statement for GL Retail Inc: P&L table 2019–2021, gross and operating margin cards, revenue trend, and an expense waterfall to net income
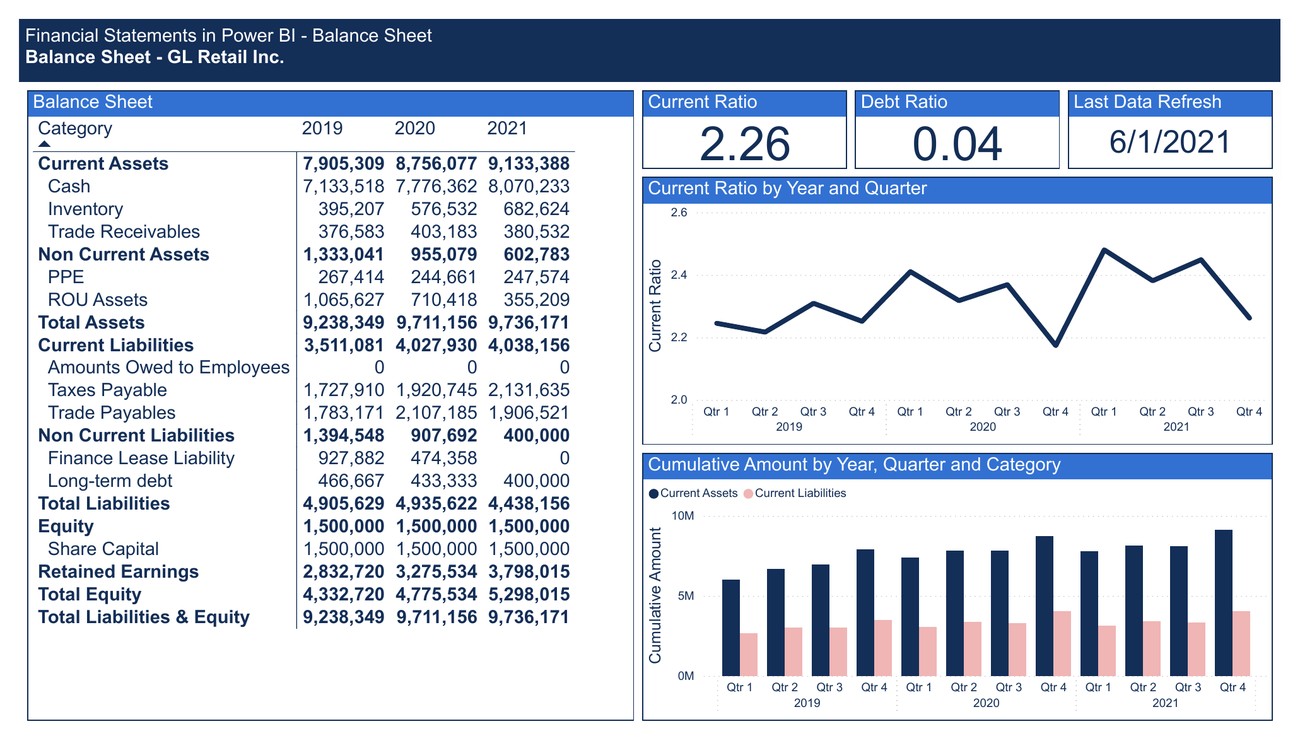
Financial Statements Power BI report — Balance Sheet for GL Retail Inc: assets, liabilities and equity 2019–2021, current ratio 2.26, debt ratio 0.04

Financial Statements in Power BI

Capstone

A general-ledger model turned into a working Income Statement and Balance Sheet. Built on a star schema, a FactGLTran fact against date, GL-account and header dimensions, with finance DAX measures for current ratio, debt ratio, gross and operating margin, and a sign-flip pattern so contra accounts read correctly. A waterfall walks revenue down to net income.

Power BIDAXStar schemaWaterfall
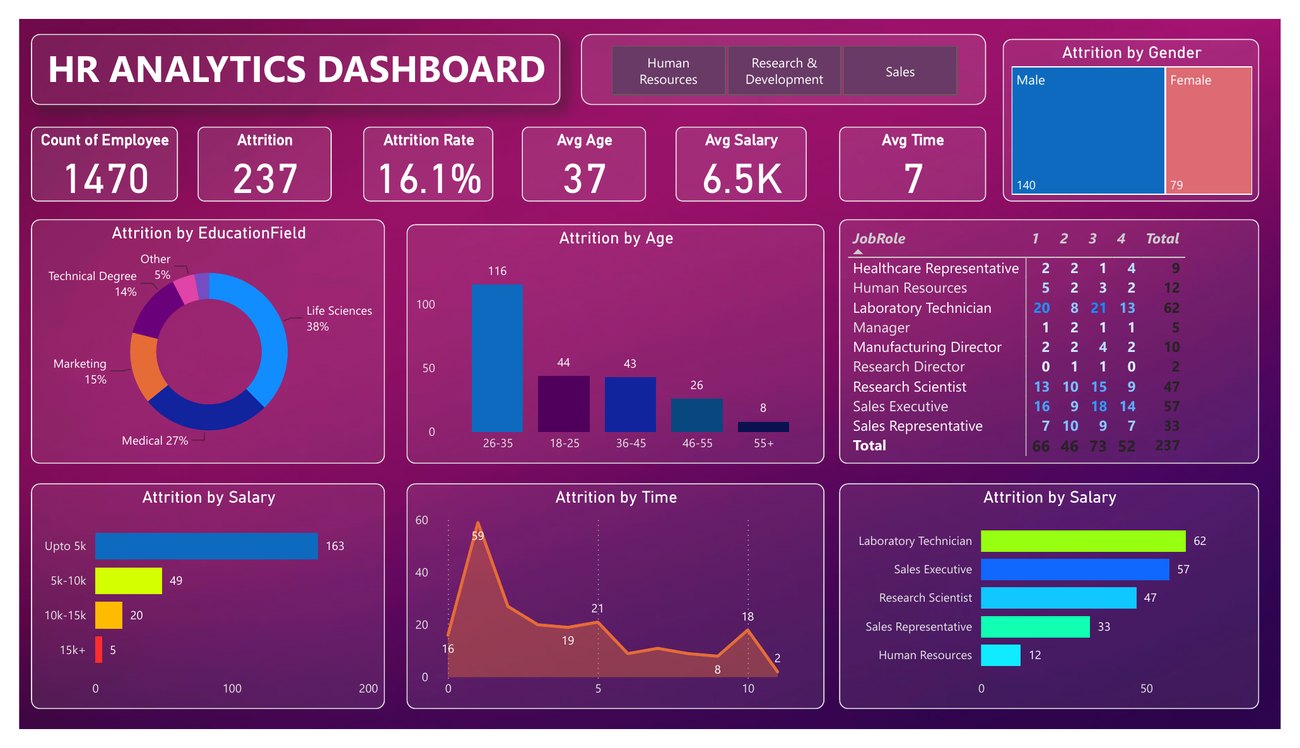
HR Analytics Power BI dashboard: 1,470 employees, 16.1% attrition rate, average age 37, attrition by education field, age band, salary band, and job role
Single view

HR Analytics · attrition

Practice

A workforce-attrition dashboard on the well-known IBM HR dataset, with KPI cards for headcount, attrition rate, average income, age and tenure, then attrition broken down by department, job role, age band and education, with a department slicer to filter the whole page. The classic first BI build, done cleanly across fifteen coordinated visuals.

Power BIKPI cardsSlicersSegmentation

These sit behind the BI certificate. The original, operator-built systems are the five case studies above.

Contact

Let's talk.

I'm looking for business analyst, data analyst and risk analyst roles in the UK. The fastest way to reach me is the form, or any of the links below.

Deepanshu Singh · England, UK Open to Business Analyst & Data Analyst roles · UK